How to use the p-value in A-level biology

The problem with biological processes is that they’re messy. The same measurements taken on different days are likely to be slightly different (in some cases very different) due to the random nature of biological molecules sloshing around in cells. Scientists call this randomness “noise”. Noisy measurements might fool us into thinking a change we observe in our experimental data is important, when in fact it’s just the universe being random. We need a way of spotting what stands out – what is significant – among all the noise – this is where we turn to statistical tests and the p-value in A-level biology.

Why do we need statistical tests and the p-value in A-level biology?

Statistical tests are simply tools scientists use to spot important results rising above the randomness or “background noise” of the universe (or inside a cell). We carry out statistical tests in A-level biology because even if a change in our data looks dramatic by eye (we might say one bar on a graph is “obviously” higher than another), the test provides the unbiased reassurance to make our conclusions confidently.

What is significance in A-level biology?

Put simply, some statistical tests work by setting a threshold (called the “confidence level” A-level biology) and then mathematically analyse the difference between two sets of data. The resulting number, called the p-value, is compared with the threshold to see if it’s higher or lower (see below for an example). Stats tests allow us to separate “real” biological differences from differences that could be explained by randomness in our measurements. Only differences rising above this noise gain the title “significant”.

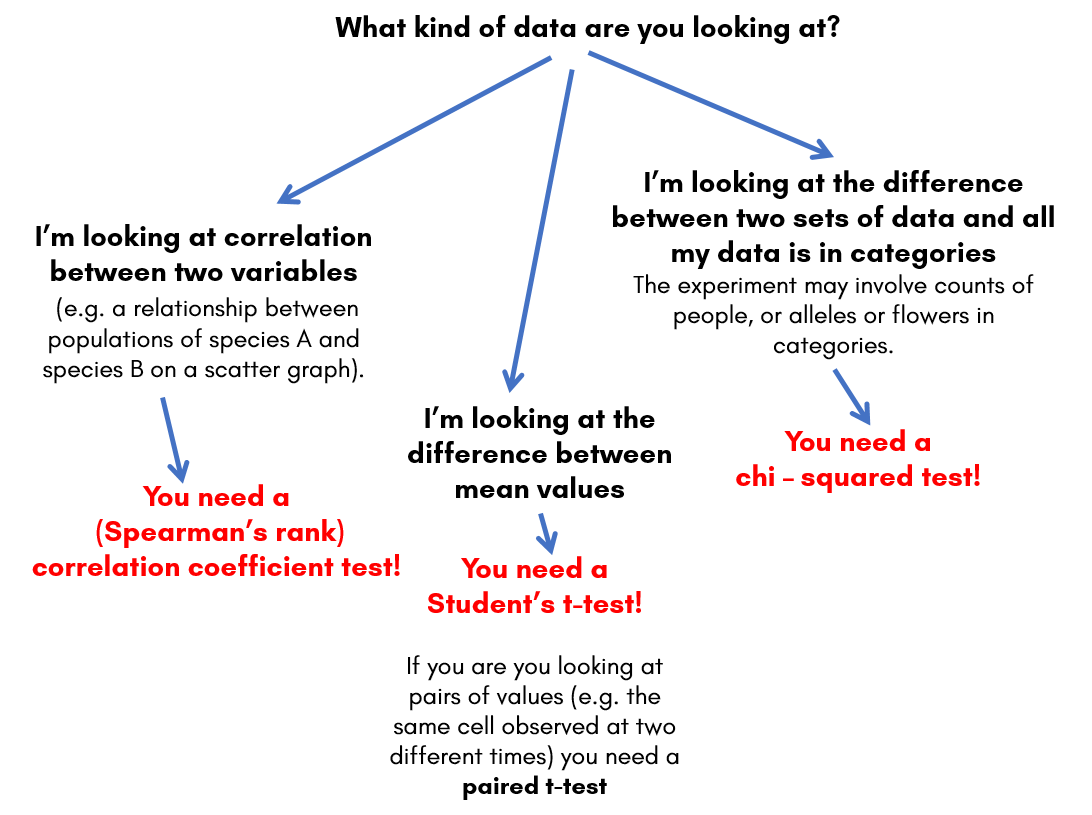
Strictly speaking, scientists will only draw conclusions if they have a significant statistical test to back them up. Scientific journals expect statistical tests, sometimes lots of them (we discuss how to choose a statistical test in another post).

What is the null hypothesis in A-level biology?

In order to be strict with our conclusions (because if we aren’t, other scientists will be!) we begin with the (rather pessimistic) view that there is no significance in our results – that there is no difference between our control data and or test data, perhaps drug X doesn’t reduce the size of cancerous tumours. This doom and gloom starting point is called the “null hypothesis”, and it’s a great place to begin – because statistics can argue that it’s wrong! If the null hypothesis is wrong or “rejected”, this means we can conclude there has been a significant effect in our data – drug X does treat the cancer.

How do we use a p-value in A-level biology?

Scientists, and A-level biology exam papers, often use a p-value threshold of 5% or 0.05. But what does that mean? If a statistical test gives us a p-value of less than this threshold, there is a less than 5% probability that the behaviour we see in our data is due to random chance – i.e. rather than noise explaining differences in our data, there is over 95% probability the difference in the data is “real”. So we “reject” the null hypothesis, and conclude that the difference we see is significant.

Imagine a graph with two bars, both representing tumour size in patients, but one involves treatment with our new drug, Drug X. The size of this bar “looks” smaller, a statistical test gives us a p-value of 0.04. What does this mean, and what can we conclude?

A full exam answer might be:

The null hypothesis is that drug X does not have an effect on cancerous tumour size.

The statistical test shows a p-value of 0.04 (or 4%) meaning there is a less than 5% probability that the difference between the data with or without the drug is due to chance (it’s far more likely that the difference isn’t due to chance) As our confidence threshold is 5%, we can conclude that the difference is significant, reject the null hypothesis and conclude the drug X does have an effect.

Exactly the same logic is applied analysing data in different contexts in A-level biology – from weed growth, to muscle strength to blood glucose levels.

Hope this helps!


How to use statistical tests in A-level biologyThere’s much more help with statistical tests, p-values, significance etc. (and model answers to statistics exam questions) in our eBook “How to use statistical tests in A-level biology”, available here


If you’d like to work through some A-level biology statistics questions, from exam boards like AQA, please get in touch with me at Woolton Tutors, and we can set up some online A-level biology tutoring sessions. Alternatively, AQA students might be interested in my weekly A-level biology masterclass sessions for practice on exam technique.

Best wishes,

John

Dr John Ankers

Specialist online A-level biology tutor and academic wellbeing coach

https://wooltontutors.co.uk

A-level biology grade boundaries 2025 and exam dates

It’s often difficult to find the A-level biology grade boundaries and exam dates all in one place, so I hope this is helpful. 🙂

Grade boundaries for the 2025 A-level biology exams

AQA A-level biology grade boundaries:
Based on 2024 AQA A-level biology results
A* 74% (192/260 marks), 63%  A (165/260), 54% B (140/260), 44% C (115/260) (scores rounded to nearest mark)
2023 grade boundaries
A* 69% (180/260 marks), 59%  A (153/260), 48% B (125/260), 38% C (98/260)

Edexcel (Salters Nuffield) A-level biology grade boundaries:
Based on 2024 Edexcel A-level biology results
A* 66% (199/300 marks), 57%  A (171/300), 48% B (144/300), 39% C (117/300) (scores rounded to nearest mark)
2023 results
A* 74% (222/300 marks), 64%  A (192/300), 54% B (162/300), 44% C (132/300)

OCR A-level biology grade boundaries:
Based on 2024 OCR A-level biology results
A* 68% (187/270 marks), 57%  A (160/270), 48% B (136/270), 39% C (112/270) (scores rounded to nearest mark)
2023 results
A* 68% (183/270 marks), 57%  A (155/270), 48% B (130/270), 39% C (106/270)

Exam dates for the 2025 A-level biology exams

AQA A-level biology (based on this page)
Paper 1 – 5th June pm (2 hours)
Paper 2 – 13th June am (2 hours)
Paper 3 – 18th June am (2 hours)

Edexcel Biology A (Salters Nuffield) (Based on this page)
Paper 1 – 5th June pm (2 hours)
Paper 2 – 13th June am (2 hours)
Paper 3 – 18th June am (2 hours)

OCR A (Based on this page)
Paper 1 – 5th June pm (2 hours 15 min)
Paper 2 – 13th June am (2 hours 15 min)
Paper 3 – 18th June am (1 hour 30 min)

Good luck! Hope these help 🙂

Best wishes,

John

Dr John Ankers

Specialist online A-level biology tutor and academic wellbeing coach

https://wooltontutors.co.uk

How to deal with maths anxiety

Maths anxiety is very common. I’ve worked with people of all ages who want to improve their maths but struggle with the idea. Sometimes emotions get in the way. Perhaps you need to pass a qualification at work? Or want to handle your finances better? Maybe you’re facing your maths anxiety “gremlins” following a bad experience at school. These can be brave choices.

Here are a few tips and ideas to help you feel better about maths:

Focus on what you need from maths

Maths is a broad subject covering everything from addition and subtraction, to shapes and statistics. Although school qualifications tend to offer a taste of all of this – if you’re returning to maths after a while away you might not need to deal with every aspect of maths. Instead, decide on what you DO need. Perhaps you want to be able to perform drug calculations for a nursing qualification? Or engineering equations? Do you simply need to refresh your knowledge for handling your accounts?

Make a list of exactly what you want from the subject. What can maths do for you? Put yourself in control.

Demystify the maths

Maths can feel impenetrable, like an ancient language, but we can soften the subject be looking calmly at what it actually is. It’s true: mathematics is a language – a language of numbers, letters and symbols that we can use to describe the world and its rules. Maths is supposed to help – to aid communication rather than act as a barrier.  Sometimes mathematicians forget this. Mathematical equations are just statements about relationships between things. These “things” are often represented by letters (this is algebra) and the story of their relationship traced by a line (on a graph). One of my first aims when tutoring students with maths anxiety is to take the sting out of it. (See below for more about our tutoring services.)

Banish the maths gremlins

Many of my adult maths students are returning to the subject after a number of years having pushed maths away. They say things like “I was never good at maths”, or “I can’t do maths” or even “I dreaded maths at school”. Sometimes they are angry, sometimes there are surprised by tears. Returning to the subject if often about more than crunching numbers, it’s actually a way to heal from a bad experience in the past. Facing these complicated feelings is incredibly brave. I am a qualified coach as well as a professional tutor. Helping people with maths anxiety draws on all these skills. With experience I will say: you can face maths gremlins from the past, and you can fill any gaps they left – and yes, you can absolutely have a smile on your face while you do it 😊

Practice your maths skills

Part of strategy for becoming comfortable with maths is practice. Firstly, because like any fear – facing it brings confidence. Sometimes you’ve just got to do it! Once you’re comfortable approaching maths, on whatever level you choose,  practice helps you keep your skills sharp. Like learning a language, practice little and often is the best way to ensure you get the most out of these skills. I’m happy to recommend books, apps, or websites like National numeracy.

Get help with your maths

If you decide you need some help with your maths you might consider a private tutor. I’ve been tutoring maths for over 10 years, and have a PhD in biology and mathematics. I’ve worked with many students from GCSE up to adult learners. My advice is to find a tutor who is right for you – who puts the concepts across in a way you understand. If you want some advice on the best way forward for you, please get in touch.

Best of luck with your maths,

John.

Dr John Ankers

Specialist online science and maths tutor
John@wooltontutors.co.uk
https://wooltontutors.co.uk


How to choose statistical tests in A-level biology

Statistical tests are tools scientists use to spot important results – those rising above the randomness or “noise” in the universe. We use statistical tests in A-level biology because even if a change in our data “looks” dramatic by eye, the test provides the unbiased reassurance to make our conclusions confidently.

Statistical tests work by setting a threshold (called the probability value level, p-value level or confidence level) used to separate important changes from differences that could be explained by randomness in our measurements. Only data rising above this threshold gain the title “significant”. 

But how do we know which statistical test to use?

Choosing statistical tests in A-level biology

Firstly, some good news – you don’t need to memorize any mathematical formulae! If you need them in the exam, they will be given to you. But you do need to know how and when use the tests. (And if you are with the OCR or Edexcel exam boards you may have to actually do some calculations.)

Which statistical test we use depends on which one best suits your data. We have a choice of three different statistical tests in A-level biology:

Chi-squared test – used when looking at differences between frequencies (data that is counted) in different categories (known as discrete data).

Student’s t-test – used to look at differences between means (averages) of data involving measurements (like lengths, or times).

Spearman’s rank correlation coefficient test– used to look at the correlation between two variables in measured data.

Here is a diagram to help you choose:

statistical tests in A-level biology

Examples of choosing statistical tests in A-level biology exam questions

Exam questions may present you with a situation – perhaps a scientist doing an experiment – and ask you to choose the appropriate statistical test. Here are some model answers to real A-level biology exam questions involving a
choice of test:

(While I cannot reproduce the questions here for copyright reasons, I have linked to the actual papers on the exam board websites.)

AQA 2022 paper 2 Q 6.5
This would require a Chi-squared test (as the data involves frequencies in categories).

AQA 2019 AS paper 2 Q8.4
This would require a t-test (this is tricky as the data presented involves frequencies, but the statistical test would be aimed at the difference between mean values – which are measurements, so it’s a t-test we need).

OCR 2022 biological processes paper Q9
We would choose B: The (unpaired) t-test. Unpaired because the data from light and dark are not related (i.e. they are not the same cells analysed different times) and a t-test because we would pool the data from cells in light vs dark areas to examine the difference between mean values.

Hopefully this helps with you choose between statistical tests in A-level biology exam questions! This blog is part of a larger study guide to A-level biology statistics (see below). I’ve also written about how to answer A-level biology evaluate questions, and application questions, but what about “Describe” and “explain” questions.

Good luck!

How to use statistical tests in A-level biologyThere’s much more help with statistical tests, p-values, significance etc. (and model answers to statistics exam questions) in our eBook “How to use statistical tests in A-level biology”, available here


If you’d like to work through some A-level biology statistics questions, from exam boards like AQA, please get in touch with me at Woolton Tutors, and we can set up some online A-level biology tutoring sessions. Alternatively, AQA students might be interested in my weekly A-level biology masterclass sessions for practice on exam technique.

Best wishes,

John

Dr John Ankers

Specialist online A-level biology tutor and academic wellbeing coach

https://wooltontutors.co.uk